Introduction
Abstract
In the 21st century media coverage is a crucial factor for political figures. As we saw in the recent Cambridge Analytica scandal, the public can often be influenced by what they read on newspapers, news websites or social media. Therefore, it could be of primary interest to study and understand media interest of different politicians over a specific time period since this interest is capable of affecting the thoughts of billions of people.
Methods
We could have a rough measure of the above mentioned interest by studying the number of quotes published on newspapers or news websites referred to a given politician on a given period. In our analysis we will focus on the years 2015-2017 and we will:
- discuss and analyze the evolution of the number of quotes referred to two of the main politicians of the American scene over the past few years: Donald Trump and Hillary Clinton.
- tell the story of the American political scene of those years by comparing it to the evolution of the number of quotes referring to the two politicians; we will identify which factors caused the peaks in the number of quotes or a lack of them.
- compare the media popularity of the two politicians over the years 2015-2017.
- compare our results with Google Trends to see if the conventional media outlets capture the online interest as well.
- try to understand which are the main differences between the speakers whose quotes refer to Trump and the ones whose quotes refer to Clinton.
Data in numbers
For our analysis we used Quotebank dataset and some data extracted from Google trends.
After the selection of the quotes related to Trump and Clinton, we have the following data.
| Politicians | Data |
|---|---|
| Donald Trump | More than 450000 quotes referred to him from more than 30000 different speakers |
| Hillary Clinton | More than 60000 quotes referred to her from more than 8000 different speakers |
Analysis of the evolution of the number of quotes
First of all, let’s take a look at the general trend of the number of quotes of the two political opponents over the years 2015-2017, feel free to interact with the plot to discover useful information. The first question which might arise spontenously is the following: who has the bigger number of quotes ? Does it relate to the politician popularity ?
As we can observe, generally speaking the number of quotes related to Trump is bigger than the number of quotes related to Clinton, but there are some periods in which this is not the case (for example at the beginning of 2015). In addition, as a general trend, we can observe that Clinton number of quotes has decreased a lot from September 2016 until the end of 2017 while the opposite is true for Trump. Which factors are related to this trends ? We will answer this question by describing the main political events in the life of the two opponents during the years 2015-2017, understanding how those events influenced their media popularity.
Year 2015: The rise of Trump consent
At the beginning of 2015 Hillary Clinton was very well known in the United States, since she had already covered several political positions such as being the first lady of the United States (1993-2001), being an US senator from New York (2001-2009) and serving as the United States Secretary of State (2009-2013). On the other hand, Donald Trump was mostly known at the beginning of 2015 as a businessman and it was not until June 2015 that he announced his entrance into the race for the White House. Interestingly, 2015 has been a year often considered as a turning point in the recent American political scene since we assist a rapid increase of Trump popularity. We will take a look at the number of quotes referring to the two politicians over the course of the year 2015.
The number of quotes at the beginning of 2015 perfectly reflects the popularity of the two politicians, Trump has very few quotes referring to him until the half of June while Clinton has a much more consistent number of quotes referred to her from the beginning of 2015.
Apparently, until the summer a very small visibility was given to Trump from the media while Clinton visibility was quite high during that period, with some small peaks at the beginning of March and at the beginning of April. The two small peaks are probably caused by the controversy arisen in March 2015 when the State’s Department inspector general revealed that Clinton had used personal email accounts on a non-government, privately maintained server exclusively, instead of email accounts maintained on federal government servers when conducting official business during her tenure as secretary of state. This event will mark the political career of Hillary and will be one of the main discussion points during the debates for the 2016 elections.
Despite the initial lack of quotes referring to Trump, he succeeded to capture an increasing media attention from the beginning of July this is why this period has often been called the summer of Trump. Indeed, Trump announced he was going to run for the presidency at 15th of June 2015 (small peak in the timeseries) and from that moment his consent started to rise. According to research, his approval rating spiked on 12th of July 2015, when he accused Mexicans of “killing us at the border” at a mass rally in Phoenix.
Eight days later his polling average climbed to 16.8% (slightly before the first detected peaks in the timeseries). We also observe that some peaks for Trump and other minor peaks for Clinton are respectively in the weeks of the first and second republican debate held the 7th of August and the 17th of September. As we can observe, despite the peaks are visible for both the opponents, the Trump’s ones are bigger. This shows how his character captured more the interest of the media compared to Hillary Clinton. For instance, the famous speech against terrorism pronounced by Clinton the 11th of November 2015 (first detected peak for Clinton) grabbed some attention but the controversial desire of Trump to ban all the muslim entering US (8th December 2015) did it in a more substantial way.
Year 2016: The year of the truth
The 2016 year was the decisive year for the future of the United States of America since the 58th presidential election was held the 8th of November of 2016. Nobody had a clear answer for the question “who will win the next elections ?”: even if Trump took a great advantage on the opponent during the summer of 2015, Clinton could count on the historical support of a great amount of Americans. The year 2016, in particular the few months before elections, have been a turning point in the result of the 2016 elections. Which events grabbed the most the media attention during this year ?
We can observe that the distribution of the number of quotes about the two politician is quite varied: there are some weeks in which the number of quotes is almost zero while in other weeks there are peaks of thousands of quotes. Moreover, we observe that the distribution is very similar for the two politicians: when one politician has very few quotes the other has very few quotes too and the same is for the peaks. Why this happens ? Which events have influenced this distribution ? How did they influence the election results ?
The media interest in Trump in the week of 21th february 2016 could probably be related to the feud between Trump and pope Francis (18 February). The pope indeed pronounced the following words “A person who thinks only about building walls, wherever they may be, and not building bridges, is not Christian.” and Trump responded quickly to the pontiff “No leader, especially a religious leader, has the right to question another man’s religion or faith”. In the following months Trump continued his political campaign attacking the rival: Trump called his likely opponent “unqualified”, and said she “should suffer” for her use of a private email server in the beginning of May (big peak for both Trump and Clinton). On top of that, a few days after, precisely the second of May, Trump accused China of “raping” US with her trade policy and this event also grabbed a lot of media attention.
The main political events which happened in the following months were the Republican and Democratic national conventions respectively the 18th-21st of July and the 25th-28th of July (representing the two highest peaks of the year). In the Republican national convention Trump won the party’s nomination to Republicans’ disbelief, Trump accepted the party nomination: “Nobody knows the system better than me, which is why I alone can fix it”. During the Democratic one Clinton became the first woman to accept the nomination of a major party in the US: “Standing here as my mother’s daughter, and my daughter’s mother, I’m so happy this day has come.” She added: “When any barrier falls in America, for anyone, it clears the way for everyone.”. From that moment on the two rivals were decided and the following months, marked by public debates, have been decisive for the result of the elections. The first presidential debate was held the 26th of September in New York. It was the most watched debate in American history, with at least 80 million people tuning in. Clinton came prepared, Trump not so much. She baited him with charges of racism, sexism and tax avoidance and he took the bait. After the first and the following debates everything was set up: people only had to vote and to wait for the results. Election day arrived soon (8th November 2016). With a big surprise Trump defeated the opponent Hillary Clinton despite Clinton received a slightly higher number of votes. From that moment on Clinton’s popularity has decreased a lot in media quotes while Trump’s one has increased drastically right after the elections with a great interest of the media on him around the 15th of December.
Year 2017: The rise of a new discontent
After the defeat of Clinton in 2016 elections, Trump was inaugurated as the 45th president of the United States on January 20, 2017. How his early actions influenced the mediatic interest on his character ? Let’s have a look at the timeseries.
As we can observe the mediatic popularity of Clinton measured by the number of quotes dropped drastically, on the other hand, Trump’s one has generally increased with respect to the two previous years. This could be caused by the fact that the first year of presidency has been full of a variety of controversies involving Trump.
One day after being sworn in as the 45th president of United States (21st Jan), the Women’s March took place. This worldwide protest was prompted by the fact that several of Trump’s statements were considered by many as anti-women or otherwise offensive to women, shortly after, the 27th of Jan, Trump signed the first travel ban executive order, halting Syrian refugees and barring citizens from seven countries for 90 days. This events, and other controversies in the first two weeks, led to the first peak (beginning of February) in the Trump timeseries. Another protest happens the 16th of February the so called Day Without Immigrants 2017 protests held throughout the United States to demonstrate the importance of immigration. This other protest is probably the cause of the other spike in the Trump timeseries in the third week of February.
We continue then to assist to an increase of number of quotes referred to Trump while the one related to Clinton stays close to zero until the second week of May, indeed the 3rd of May Hillary Clinton was the featured speaker at the Women for Women International were she, among other topics, blamed Russian interference in the US election for her loss and in the 10th of May the meeting of Trump and the Russian Foreign Minister Ambassador took date.
Th biggest peak in the number of quotes referred to Trump was during the third week of August, indeed in that period (the week before) the Unite the Right rally: a white supremacist rally took place in Charlottesville, Virginia. Far-right groups participated, including self-identified members of the alt-right, neo-Confederates, neo-fascists,white nationalists and neo-Nazis. Some groups chanted racist and antisemitic slogans and carried weapons, Nazi and neo-Nazi symbols. Despite Trump condemning the acts in Charlottesville, many people linked the participants of the rally to Trump supporters and the discontent started to rise.
At the end of august 2017, according to the results of the poll of NCB news:
- 39 percent of Americans approved of Trump’s job as president (compared with 59 percent who disapprove)
- 36 percent had a favorable impression of the president (versus 61 percent with an unfavorable view)
- 38 percent believed immigration hurts the country more than it helps (versus 57 percent who think it helps more than it hurts)
Therefore, despite the number of quotes referring to Trump in 2017 is high, most of them are due to the fact that some controversial facts happened in the United States during that period. This shows that having a great mediatic interest does not always mean that the character is appreciated by the population.
Google Trends comparison
According to recent studies of Pew Research center about half (48%) of U.S. adults say they get news from social media “often” or “sometimes”. As a consequence, nowadays, it is not sufficient anymore to study the popularity of a given character on conventional media, we need to study his popularity also in social media and more in general online. Therefore, a question which might arise spontanously is the following: is the mediatic interest linked to the online interest ? To answer this question we will use data from Google trends.
We will compare the evolution of the number of quotes during the years 2015-2017 for both Clinton and Trump with Google Trends number of searches in Google of the two politicians in the United States area. For the sake of simplicity we will consider only Trump quotes and Trump trends.
As we can observe, in 2015 the two curves behave in a similar way. However, the same is not true for the years 2016-2017. This is probably caused by the fact that the years 2016 and 2017 are quite special when it comes to Trump. For example, in 2016 we observe a great amount of quotes before election periods and a few quotes during election period, while the opposite is true when it comes to Google Trends plot. The reason which could explain the behavior of the two distributions could lie on the fact that even if linked, the mediatic interest and the number of queries is not totally related. For instance, in that case, mediatic attention rose more for previous debates than for election while online interest rose more right after the elections. A similar reasoning applies to 2017: events such that the Women’s March are able to attract more the online attention (also thanks to social media) while often this is not the case for newspapers or news websites.
Analysis of speaker attributes
In order to provide a complete description of the popularity of a politician, it’s of the utmost importance to have an in-depth analysis of the characteristics of the individuals that talk about this political figure. Afterwards we’ll provide a data driven analysis focused on describing the Age, the Gender, the Ethnicity and the Nationality of Trump and Clinton speakers.
Age
According to conventional wisdom people tend to become more conservative as they grow older, recently the University of Chicago Press elaborated a study that tries to access if the convential wisdom holds and how much so, in our work we will take a look at how the distribution of ages of Conservative Republican Donald Trump relates to the distribution of ages of his counterpart Democrat Hillary Clinton, do you think the conventional wisdom holds? Let’s take a look!
Trump Age Distribution
As we observe the median age of a Trump speaker is 59 years old, interestingly the interquartile range is only 21 years with the first quartile ending at 48 years old and the third quartile ending at 69 years old, therefore 75 % of the speakers have more than 48 years. Another interesting observation relates to the skewness of the curve in the right and left sides of the distribution, it’s noticeable that the skewness is slightly bigger on the right side compared to the left side, one possible explanation is the inherent biological restrictions of the human body, since the global live expectancy is calculated to be around 72 years old.
Clinton Age Distribution
As we observe the median age of a Clinton speaker is 60 years old, interestingly the interquartile range is only 22 years with the first quartile ending at 49 years old and the third quartile ending at 71 years old, therefore 75 % of the speakers have more than 49 years. Following the reasoning from the Trump Distribution, here one can also see that the right side of the distribution is more skewed than the right side, however the higher median and third quartile values mean the biological restriction will be even more visible, therefore having a skewness much higher in compared to the left side.
Age Comparison
From the distribution it could seem that Clinton’s speakers are a bit older in general with respect to Trump’s speakers, since as we mentioned before Trump’s median is one year less than Clinton’s median and the third quartile value is two years less than Clinton’s as well. Additionally it’s also notable that the age distribution deviates from the Authors distribution, maybe we can reason that people in their 40s, 50s and 60s are more prone to talk about politics, maybe one of the reasons why this happens relates to younger people not having enough knowledge of the recent political history, in order to correctly access the state of the country, and older people are not as prone to spend energy talking about such complex topic.
Is the difference statistical significant?
Technically by computing a Student t-test for both distributions we can compute the p-value of the null-hypothesis stating that the two distributions have the same mean. The resulting p-value for the mean of Clinton’s and Trump’s speaker is 2.3e-05, conventionally with such a low p-value it’s often stated that we can reject the null hypothesis, therefore implying the difference to be statistically significant. In the end, we can conclude that on average the age of Trump speaker is smaller than the average of a Clinton speaker, therefore if we assume people talk more often about the people they support, this would be contradicting the conventional wisdom. However, recently there is an increasing amount of critique surrounding the speech of most authors, so we can be observing the inverse pattern, where a Trump Speaker would be more likely to be supporting Clinton, in this case the conventional wisdom would hold true. To sum up the data doesn’t provide insights on the truthfulness of the conventional wisdom.
Gender
Nowadays, the relationship between gender and politics is a very hot topic. The study of gender and politics focus on how peoples’ genre determines their participation in and experience of political events. One of the central concerns of this topic relates to the exclusion of women from politics, it’s clear that the participation is not equal, therefore most democratic societies are focusing on changing the current situation. Should we expect different ratios from men and women to contribute to politics? What’s the current situation in terms of numbers? Let’s see!
Trump Gender Distribution
Given the number of males and females speaking about Trump, we clearly see a 3.23 male / female ratio, this means that for every female that speaks about Trump we have on average 3.23 males speaking about Trump.
Clinton Gender Distribution
Given the number of males and females speaking about Clinton, we clearly see a 2.80 male / female ratio, this means for every female that speaks about Clinton, we have on average 2.8 males speaking about Clinton.
Gender Comparison
As we can see the percentage of men talking about Trump is the same as the general author distribution (the distribution of the gender of all the speakers in quotebank dataset). However, interestingly, the percentage for Clinton’s speakers deviate a lot from the author distribution. One possible explanation for this phenomena can relate to the more general support of females since Hillary Clinton could have potentially been the first female President of the US at that moment.
Is the difference statistical significant?
We computed the 5 % confidence intervals for Trump and Clinton ratio of gender, since we got [2.61, 3.00] for Clinton and [3.01, 3.37] for Trump, we can easily spot that the two confidence intervals don’t overlap, therefore the difference in ratios is statistically significant.
Nationality
United States of America is an undeniable global power, therefore, the results of each presidential election have consequences all around the globe. This being said, it is clear that this political event captured the attention of speakers from all around the world. Our study of nationality aims to find which nationalities showed more interest in the two rivals for the presidential election of 2016. Which politician is more popular outside and inside U.S.A. Let’s see!
Trump Nationality Distribution
As we can see the majority of the speakers are from United States which is exactly what we would expect. There are several other speaker nationalities which are quite frequent as United Kingdom, Canada, Australia,… . These numbers don’t seem strange to us. Indeed, it could be that the majority of the speakers come from an english language speaking country, and this is why we have a huge number of quotes associated to speakers coming from english language speaking country for Trump too. Can we observe a similar bias for Clinton too ?
Clinton Nationality Distribution
We notice that a similar effect can be seen in Clinton speakers nationalities too. Despite most of the major nationalities of the speakers being similar, there are some differences between the two distributions. We will visualize in a single plot the two distributions together, additionally we will plot the general distribution for the nationality of the whole dataset of speakers to have a better comparison.
Nationality Comparison
As we can observe in the plot above, the general author distribution of the nationalities is not so biased by nationalities of coutries with english language since between the leading nationalities for the speakers there are several european nationalities such as France, Germany, Spain in which the national language is not English. Comparing both Trump’s and Clinton’s speakers’ nationality distributions we notice that there are noticeable differences between the two distributions. Indeed, we can see that there are more people with American nationality speaking about Clinton than Trump while for example the people from European Union (at least the representative countries we have in the plot) are more likely to speak about Trump rather than Clinton. Also in Canada, and Israel people are speaking more about Trump than Clinton. This suggests that Trump character is more known outside United States of America while Clinton seems to be more popular in her origin country. This information could be of primary interest for studies about the political basis of the two politicians.
Machine Learning Interpretable Models
In order to better interpret which features can be considered predictive, when classifying an author as either a Trump Speaker or a Clinton Speaker, we will train a Logistic Regression and a Least Squares models. These models will not be trained to really fit the data (otherwise we would have chosen more complex models) but they will be trained to interpret and to clarify which features characterize better the Trump’s speakers and the Clinton’s speakers.
Logistic Regression Model
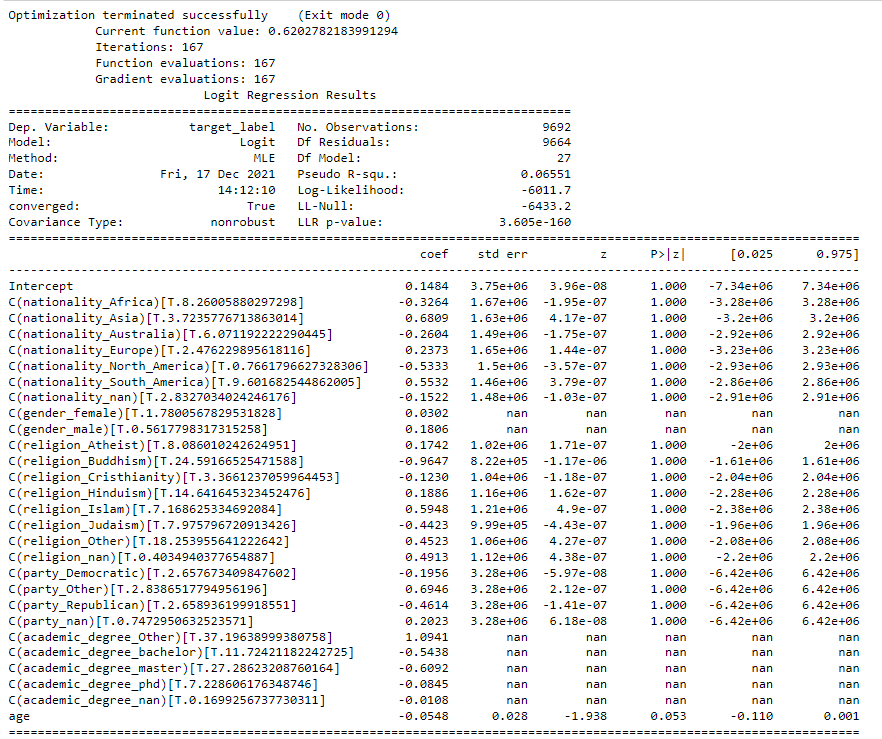
Logistic Regression is usually a good, simple and interpretable model for classification tasks, however as we can see from the pseudo-R2 coefficient, the fit in this case is not great. Additionally, we have a big number of non defined values coupled with very high p-value for most coefficients since the huge amount of zeros in the training matrix caused collinearity problems. That being said we can’t make many meaningful conclusions, unless for the age predictor.
Model Conclusions
By looking at the coefficients with low p-value and their respective sign we can make the following conclusion:
- A negative coefficient in the age features with a p-value smaller than the threshold (we choose 0.06), tells us that age is a statistically significant positive predictor for Clinton speakers. That means that increasing the age of a speaker it is more likely for him to have quotes referred to Clinton with respect to quotes referred to Trump.
- We cannot state with statistical significance that the other features are positive or negative predictors since the p-value is above the chosen confidence level 0.06 which means that the coefficients in the model could potentially be all zeros a part from the age coefficient. However, from a simpler point of view, we could say that the model suggests that all the features with negative coefficients in the table above are positive predictors for a speaker to be a Clinton speaker. On the other hand the positive coefficients are positive predictors for a speaker to be a Trump speaker. However, it is remarkable that in this case we don’t have any statistical significance of these results.
Note: We considered the 6 % significance level for our analysis.
To try to overcome the problems of the logistic regression model we will try another interpretable model suitable for classification tasks.
Decision Tree Model
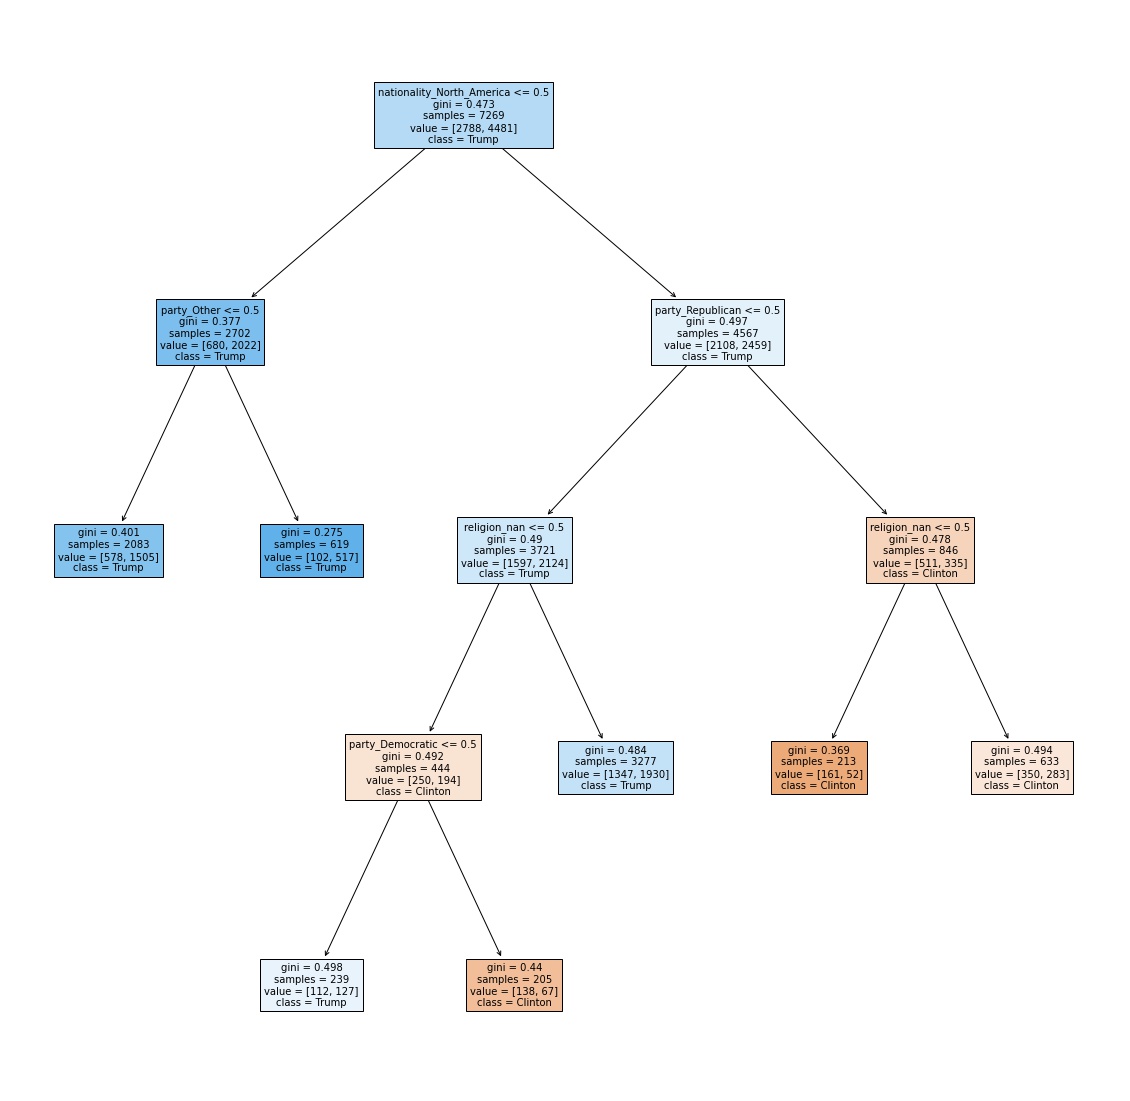
First of all, it is remarkable that in the training set we have 4481 Trump’s speaker and 2788 Clinton’s speakers. The ratio between Trump’s speakers and Clinton’s speaker is then 1.61 which means that for each Clinton’s speaker there is on average 1.61 Trump’s speakers. The feature which the model consider the one which could distiguish more the two classes is Nationality_North_America. Indeed, we have already studied in the nationality section how Clinton has a bigger proportion of speakers with American nationality. The model shows again that this is the case since if the Nationality is North_America (second node from the left between the nodes with depth one), then the new ratio of Trump’s vs Clinton’s speakers is 1.17 while in case the nationality is not North America the new ratio is 2.97 (first node from the left between the nodes with depth one). This may suggetsts that North_American nationality is a positive predictor for Clinton’s speakers but it is not sufficient alone to classify Clinton speakers and Trump’s speakers for the model.
Now we will have a look at the leafs of our tree to understand which are likely profiles of Trump’s and Clinton’s speakers. Looking at the first two leaves of the first left subtree (first ad second leaf from the left at depth 2), we notice that a speaker is classified as a Trump’s speaker when his nationality is not a nationality from a North American country. We could then conclude that having a nationality different from a North American one is a positive predictor of being a Trump’s speaker. Now looking at the first leaf from the left in the tree at depth 3, we notice that a speaker is classified as Trump’s speaker if he/she has a nationality from a North American country, he/she is not republican and we don’t have any information concerning her/his religion. On the other hand, looking at the second and third leaves from the left in the tree at depth 3 we have that a speaker is classified as a Clinton speaker if his nationality is from a country of North_America, he/she is republican. Finally, looking at the first leaf at depth 4, we have that a speaker is classified as Trump if he/she is from North America, he/she is not republican and not democratic and we have information concerning the religion. Finally, a speaker is classified as a Clinton speaker if he/she is from North America, he/she is democratic and we have information concerning the religion.
Model Conclusions
If we consider that when the above mentioned ratio is above 4.83 or below 0.54 (respectively 3 times and 1/3 times the initial ratio), we have that a speaker is quite likely to be a Trump’s and a Clinton’s speaker respectively, we have that:
- If someone has a nationality from a country not in North America and not belonging to democratic or republican party, then it is likely to be a Trump’s speaker.
- If someone has a nationality from a country in North America, is Republican and without any declared religion in the dataset, then it is likely to be a Clinton’s speaker.
- if someone is from North America, he/she is democratic and we have information concerning the religion, then it is likely to be a Clinton’s speaker.
Notice that the results match at least partially with the previous analysis. Indeed, we have already seen in the nationality section that Clinton’s speakers were more likely to have a nationality from a country in North America. In addition, if they don’t belong to Republican or Democratic party they again are not likely to come from US and so not to have a North American nationality. Therefore, the differences observed in the nationality section match with the result of the model. Concerning the Clinton’s speakers, the model gives new insight on the potentially good profile of Clinton’s speakers.
Conclusion
In this Project we provided a detailed analysis of the US political landscape from 2015 up to 2017, we studied the “popularity” of two of the main politicians in the United States in those years using the number of quotes referred to them in newspapers and news websites. We used timeseries to identify the trend of the popularity and to relate it to the main events in the political scene of those years, we also compared it with Google Trends to see if the number of quotes capture the online interest as well.
Moreover, throughout our project we carefully studied the characteristics of authors whose quotes are referred to the two key political figures during that time. By looking at these two distinct groups we can reason about the two different basis of the two politicians and we could therefore extend our analysis underlying the differences between the democratic and republican basis. In the end, we created a model to predict whether or not someone is a Trump or a Clinton speaker, the results of the model can provide insights as to whether a person’s characteristic such as age or gender can be used as a predictor for the task at hand understanding in this way which feature is more common in the Trump basis or in Clinton basis. To sum up our project’s goal was to provide a detailed data centric view of the popularity and polarization of the aforementioned political figures for different groups of people.